From Bearish to Bullish: How to Trade the Triple Bottom Chart Formation
Oct 22, 2024 By Elva Flynn
Imagine this: you're tracking a stock that's been stuck in a frustrating downtrend for weeks. Just when you're about to give up, the price hits the same low three times. Instead of collapsing, it bounces back, each time gaining a little more strength. You're witnessing the early stages of the Triple Bottom patterna rare but powerful signal that a bullish reversal is on the horizon.
Trading this pattern isn't just about recognizing the shape, though. It's about timing, risk management, and strategy. In this guide, you'll learn how to spot, confirm, and trade the Triple Bottom pattern like a seasoned pro. Ready to flip the trend in your favor? Let's dive in!
What is a Triple Bottom Chart Pattern?
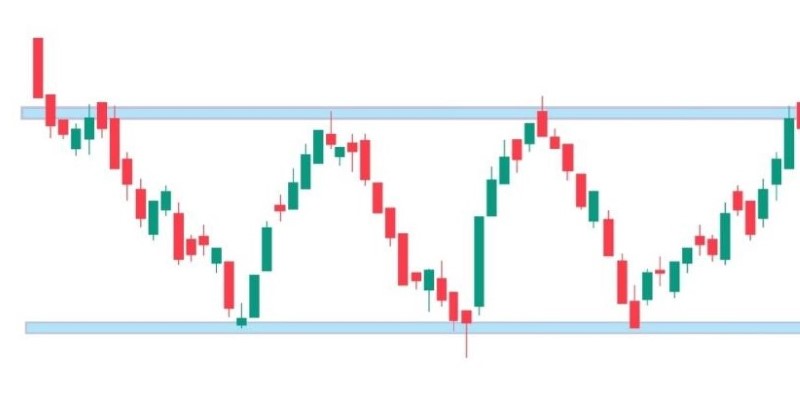
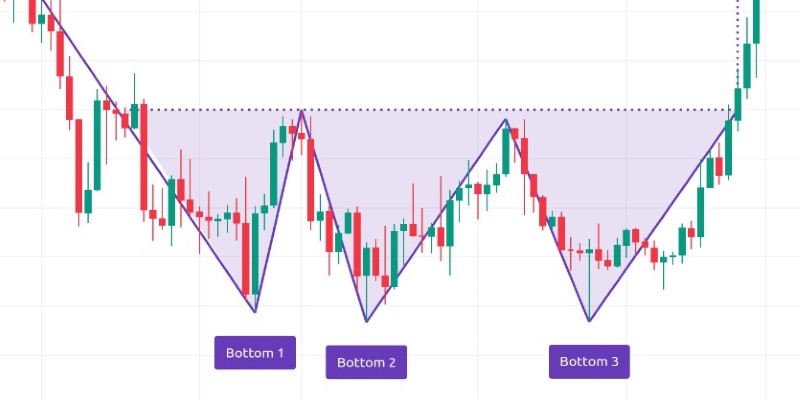
A Triple Bottom chart pattern typically forms after a sustained downtrend. It consists of three distinct lows at approximately the same price level, each followed by a rebound that fails to surpass a resistance level established by two intermediate highs between the lows. This pattern reveals that the downward momentum is waning, with buyers stepping in at key support levels, eventually leading to a bullish reversal once the price breaks above the resistance.
The key components of the Triple Bottom pattern are:
- Three lows: Each low marks a significant point where the price finds support and rebounds.
- Resistance level: The highs between these lows form a resistance level that the price must break through to confirm the pattern.
- Breakout: The pattern is validated when the price breaks above the resistance level, indicating a potential shift in market sentiment from bearish to bullish.
Identifying the Triple Bottom Pattern

To identify a Triple Bottom pattern, traders need to observe several factors:
Downtrend Preceding the Pattern: The Triple Bottom is a reversal pattern, so it must form after a downtrend. If the market is already in an uptrend, the pattern won't be valid.
Three Distinct Lows: These lows should be at or near the same price level, with each low representing a point where selling pressure is weakening.
Resistance Line: This is formed by connecting the highs between the lows, acting as a key level that the price needs to break for the pattern to be confirmed.
Once these elements are in place, the breakout beyond the resistance signals the potential for a bullish reversal.
Trading the Triple Bottom Pattern
Step 1: Confirm the Pattern
After identifying the Triple Bottom formation, the next step is to wait for the price to break above the resistance level. This breakout is your signal to enter a long position, as it indicates a shift in the market from bearish to bullish sentiment. However, be cautious of false breakouts, where the price briefly moves above the resistance but fails to maintain upward momentum, potentially leading to losses.
Step 2: Entry and Exit Points
Entry Point: The best time to enter a trade is immediately after the breakout above the resistance level. Some traders prefer to wait for a retest of the resistance level, which often turns into support after the breakout.
Exit Point: The most common method to determine the exit point is to measure the distance between the resistance level and the lowest low of the pattern. This measurement is then projected upwards from the breakout point to set a profit target. For example, if the distance between the lows and the resistance is $10, you might set your profit target $10 above the breakout point.
Step 3: Risk Management
Effective risk management is essential when trading the Triple Bottom pattern to avoid significant losses. Traders should place a stop-loss just below the lowest point of the three bottoms to protect against false breakouts or unexpected reversals. This ensures that if the price fails to break out or reverses sharply, the loss is limited. By setting this safety net, traders can control risk and avoid letting small losses escalate into larger ones.
Step 4: Volume Confirmation

Volume plays a crucial role in confirming the validity of a Triple Bottom breakout. An increase in volume during the breakout signals strong buying pressure, lending credibility to the bullish reversal. Without sufficient volume, the breakout may lack conviction, increasing the likelihood of a false breakout. Traders should monitor volume closely during the breakout, using it as a key indicator to determine whether the market is supporting the upward move.
Common Challenges with the Triple Bottom Pattern
While the Triple Bottom pattern can be highly reliable, it comes with certain risks and challenges:
False Breakouts: As mentioned, false breakouts are a common issue. To avoid them, wait for confirmation through increased volume or a clear candlestick close above the resistance level.
Time Considerations: The Triple Bottom pattern can take a long time to develop, sometimes spanning several weeks or even months. Patience is essential when waiting for the pattern to complete.
Combining Indicators: To improve your trading accuracy, combine the Triple Bottom with other technical indicators such as the Moving Average Convergence Divergence (MACD) or Relative Strength Index (RSI), which can confirm the trend reversal and add confidence to your trade decisions.
Market Sentiment Shifts: Sudden changes in market sentiment due to external factors like news events or geopolitical developments can disrupt even well-formed Triple Bottom patterns. Staying informed about broader market conditions helps mitigate risks from unexpected volatility.
Conclusion
The Triple Bottom chart pattern is a valuable tool for traders looking to capitalize on bullish reversals. By understanding the structure of the pattern and applying disciplined risk management techniques, you can increase your chances of executing profitable trades.
However, like any technical analysis pattern, its crucial to combine the Triple Bottom with other indicators and confirmation tools to ensure higher accuracy. Patience, discipline, and careful observation are key to mastering the Triple Bottom and using it effectively in your trading strategy.

Introduction to Law of Supply and Demand

From Bearish to Bullish: How to Trade the Triple Bottom Chart Formation

Business Automobile Policy

Debt Collection: Is There a Statute of Limitations?

Gross Debt Service Ratio

Other benefits of CBDC that the central bank has taken into account

Bureau of Labor Statistics Explained: Functions and Operations

Difference Between Mortgage Lenders vs. Banks

Federal Open Market Committee (FOMC)

Naked Call Writing: A Comprehensive Guide

6 Ways to Get a Free Google Ads Promo Code in 2024 – A Comprehensive Guide
